
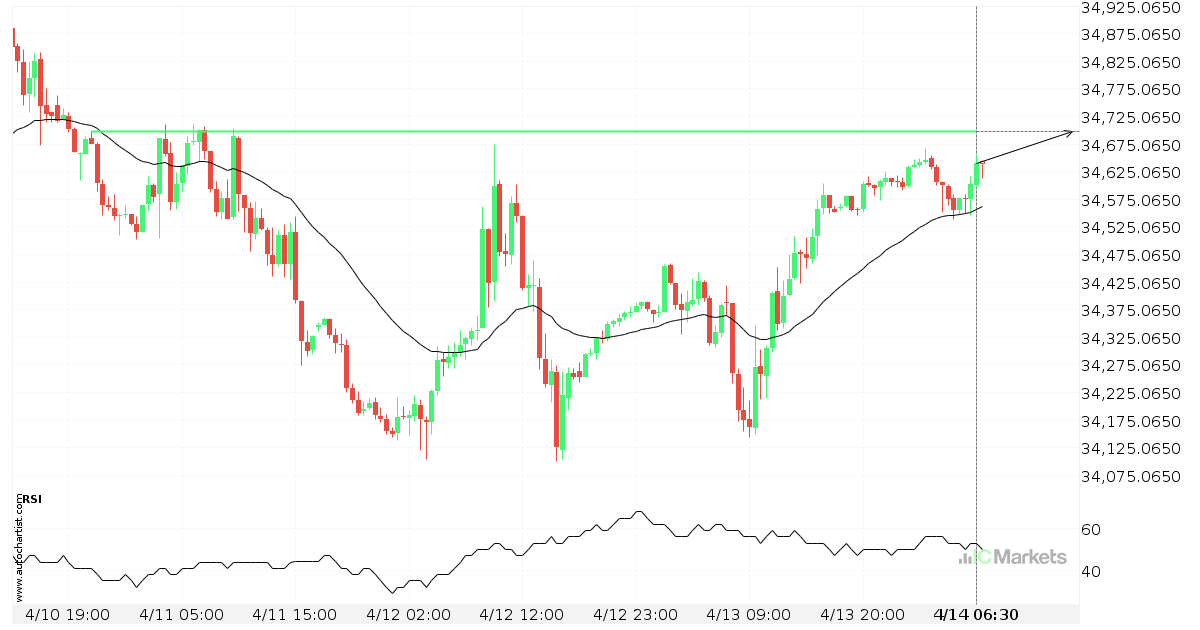
A final push possible on US Wall Street 30 Index
US Wall Street 30 Index is heading towards 34697.0000 and could reach this point within the next 19 hours. It has tested this line numerous times in the past, and this time could be no different, ending in a rebound instead of a breakout. If the breakout doesn’t happen, we could see a retracement back […]
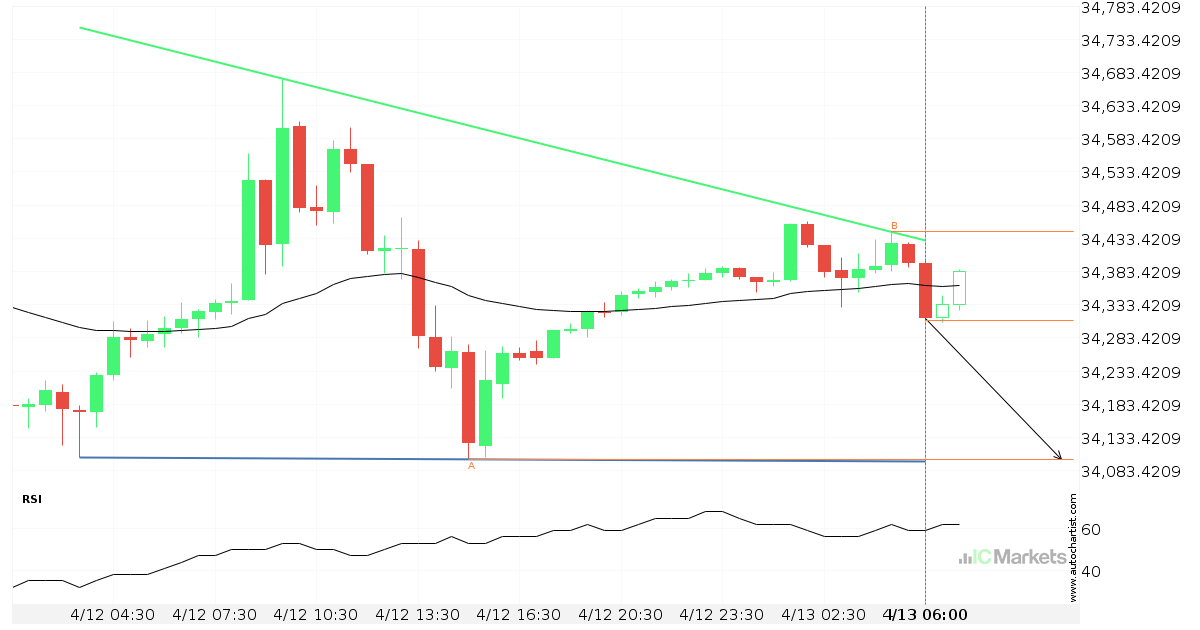
US Wall Street 30 Index – getting close to support of a Triângulo Descendente
US Wall Street 30 Index is moving towards a support line. Because we have seen it retrace from this line before, we could see either a break through this line, or a rebound back to current levels. It has touched this line numerous times in the last 2 days and may test it again within […]
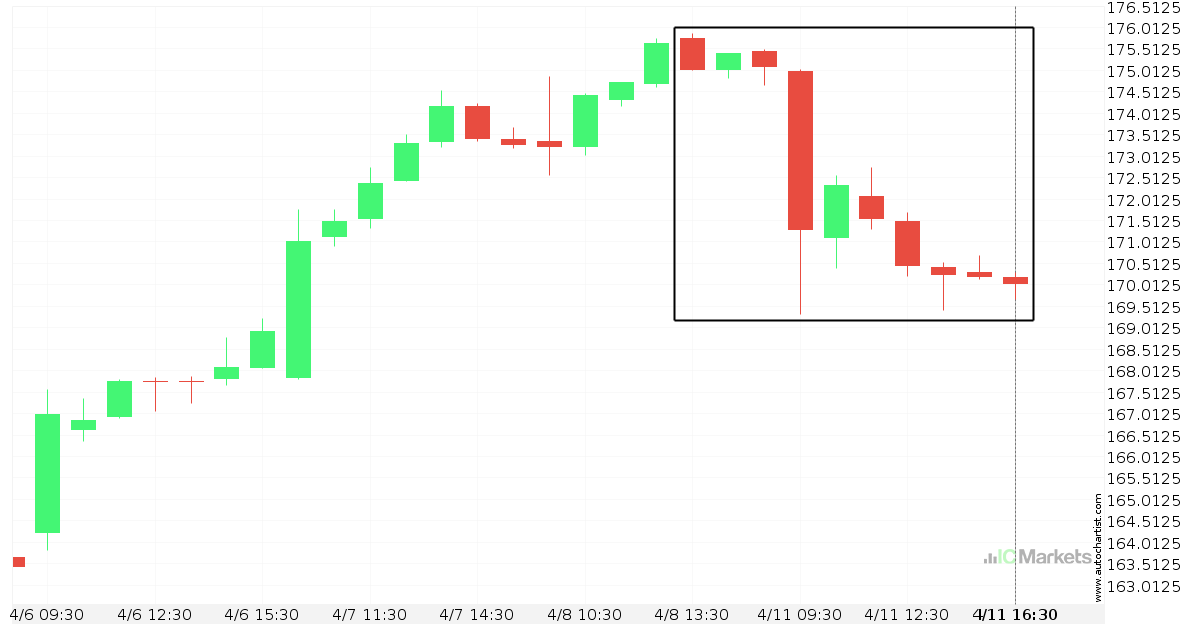
What’s going on with AbbVie?
Those of you that are trend followers are probably eagerly watching AbbVie to see if its latest 2,84% move continues. If not, the mean-reversion people out there will be delighted with this exceptionally large 4 days move.
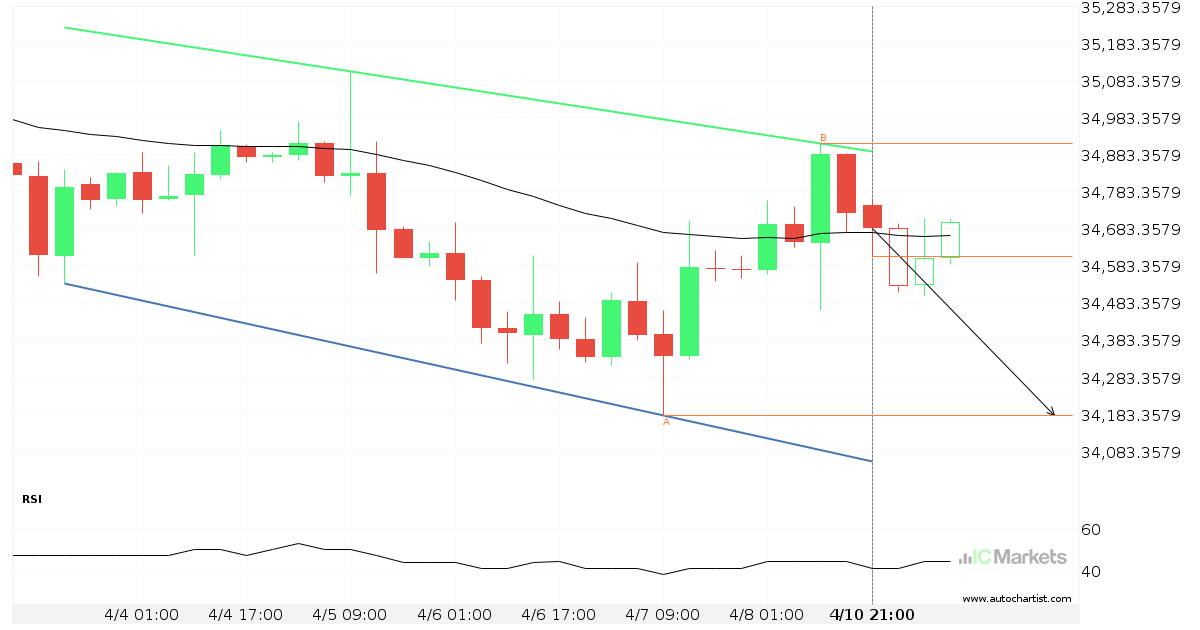
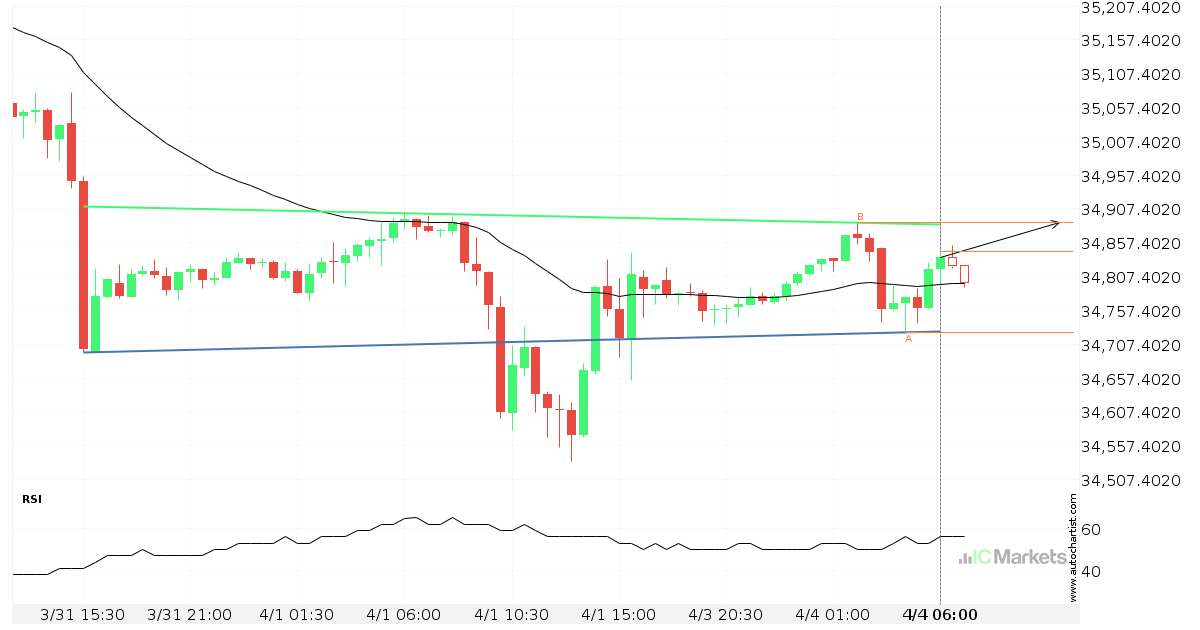
US Wall Street 30 Index – getting close to support of a Canal descendente
US Wall Street 30 Index is moving towards a support line. Because we have seen it retrace from this line before, we could see either a break through this line, or a rebound back to current levels. It has touched this line numerous times in the last 10 days and may test it again within […]

Either a rebound or a breakout imminent on US Small Cap 2000 Index
US Small Cap 2000 Index is heading towards the resistance line of a Triângulo Ascendente. If this movement continues, the price of US Small Cap 2000 Index could test 2018.0500 within the next 5 hours. It has tested this line numerous times in the past, so this movement could be short-lived and end up rebounding […]
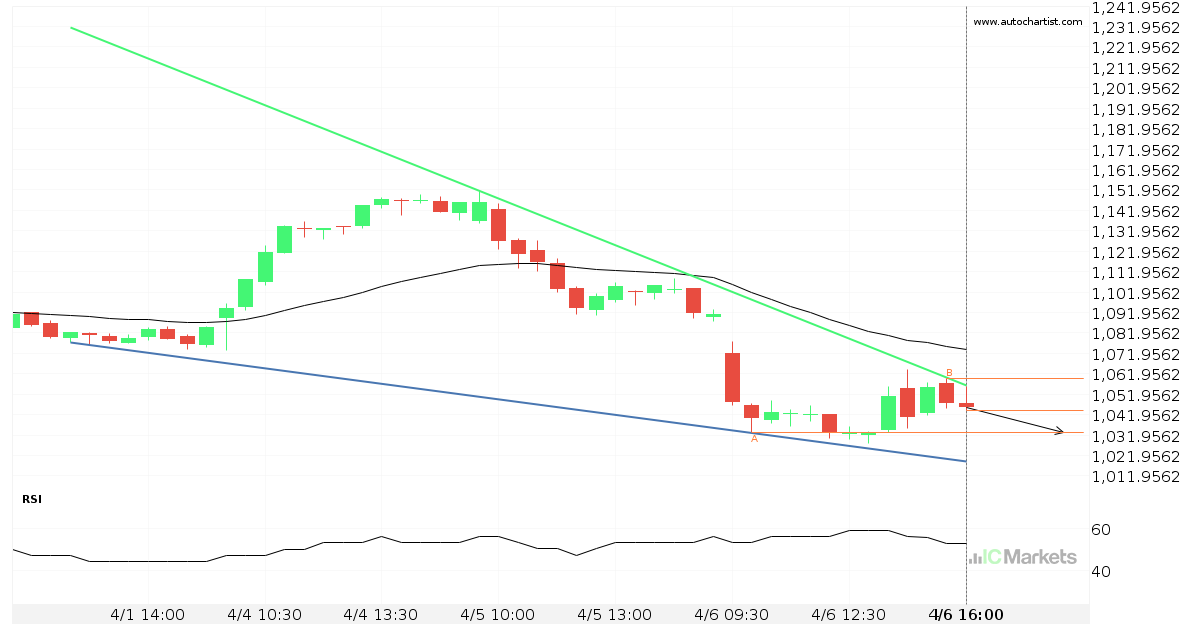
Tesla Inc. – getting close to support of a Cunha descendente
Tesla Inc. is moving towards a support line. Because we have seen it retrace from this line before, we could see either a break through this line, or a rebound back to current levels. It has touched this line numerous times in the last 6 days and may test it again within the next 7 […]
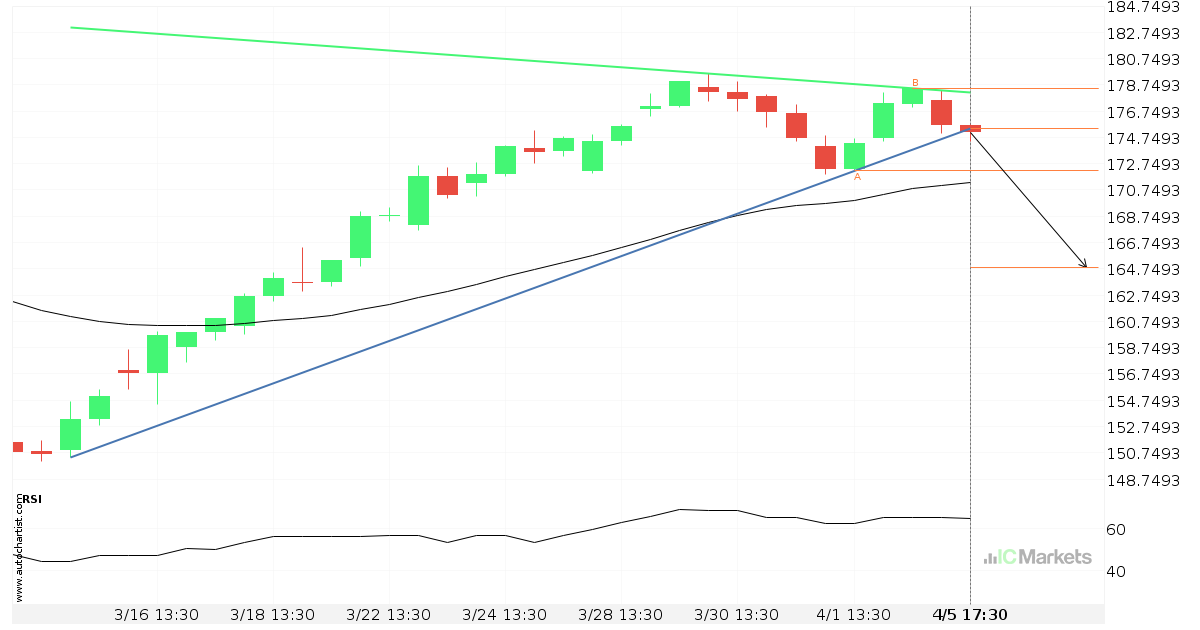
Should we expect a bearish trend on Apple Inc.?
The breakout of Apple Inc. through the support line of a Triângulo could be a sign of the road ahead. If this breakout persists, we may see the price of Apple Inc. testing 164.8850 within the next 2 days.
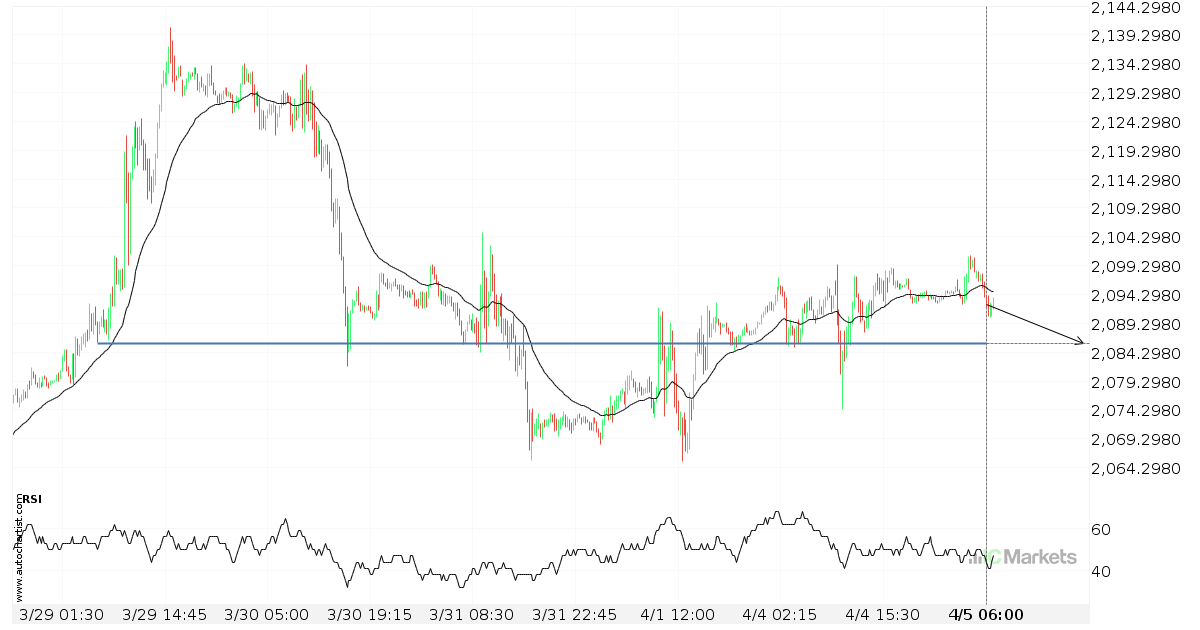
Either a rebound or a breakout imminent on US Small Cap 2000 Index
US Small Cap 2000 Index is heading towards a line of 2085.7700. If this movement continues, the price of US Small Cap 2000 Index could test 2085.7700 within the next 2 days. But don’t be so quick to trade, it has tested this line numerous times in the past, so this movement could be short-lived […]
Will US Wall Street 30 Index have enough momentum to break resistance?
US Wall Street 30 Index is heading towards the resistance line of a Cabeça e Ombros Inverso and could reach this point within the next 10 hours. It has tested this line numerous times in the past, and this time could be no different from the past, ending in a rebound instead of a breakout. […]
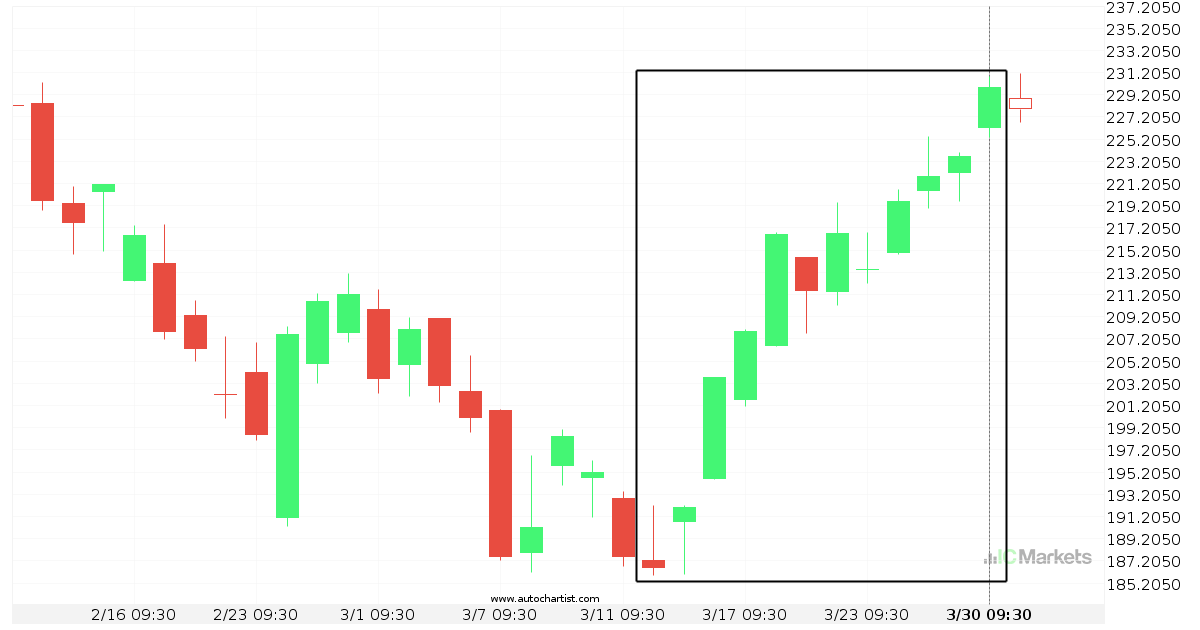
Huge bullish move on FACEBOOK
FACEBOOK has moved higher by 23,26% from 187,2 to 229,88 in the last 17 days.